Ever deployed an application to Kubernetes only to see it mysteriously crash with an OOMKilled error? Or maybe you're on the other end of the spectrum, looking at your AWS bill and wondering why your giant cluster is barely being used. You're not alone.
Setting the right CPU and memory requests and limits for your workloads maybe is one of the trickiest parts of running many workloads in shared Kubernetes environments. It often feels more like a dark art than a science. Guess too low, and your app becomes unstable. Guess too high, and you're just wasting money on resources you don't need.
But what if you could stop guessing? In this guide, I go through a practical, data-driven approach. I'll share exactly how to use the power of AWS CloudWatch to find that "just right" size for your Kubernetes pods, saving you money and future headaches.

A Quick Refresher on Requests and Limits
Before we dive in, let's quickly recap what CPU and memory requests and limits are in Kubernetes:
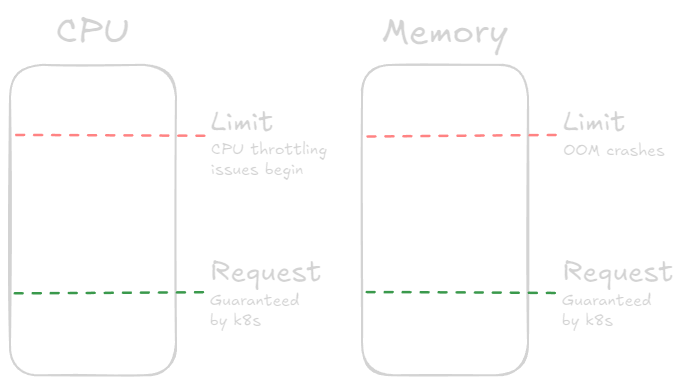
Requests: This is the guaranteed amount of resources a container will get. The Kubernetes scheduler uses this to decide where to place a pod. Think of it as the minimum your app needs to run smoothly.
Limits: This is the maximum amount of resources a container can use. If your app tries to exceed this limit, it will be throttled (for CPU) or killed (for memory). This is your safety net to prevent a single pod from hogging all the resources on a node and perhaps an escape hatch for runaway processes.
For more details, check out the Kubernetes documentation on resource management.
Guiding Principles
The core philosophy is a three-step cycle: Observe, Calculate, and Tune. We begin by observing a pod's behavior under real-world load without predefined requests or limits. We then use statistics of this data to calculate sensible starting values. Finally, we apply these values and continue to monitor and tune them over time.
Key Assumptions:
- This process assumes you are gathering metrics from pods that do not have existing requests or limits configured. This allows the pod to use as many node resources as it needs, revealing its true consumption pattern.
- The node must have sufficient capacity to handle the pod's peak usage and should not be running other resource-intensive workloads during the observation period so it's not constrained.
Step 1: Observe - Gather Real-World Metrics
The Hero of our story is AWS CloudWatch. If you're running your Kubernetes cluster on AWS (like EKS), CloudWatch can be a goldmine of performance data. Getting your pod's historical CPU and memory usage metrics over a representative period is the first step.
From CloudWatch Container Insights, focus on these two primary metrics for each pod:
pod_cpu_utilizationpod_memory_utilization
For each metric, you will extract two different statistics to serve two different purposes: setting a baseline (request) and setting a ceiling (limit).
For Baselines (
requests): Use Trimmed Mean.- Statistic:
TM(10%:90%)(Trimmed Mean) - Why: This is the cornerstone of a stable baseline. By calculating the average usage after removing the top and bottom 10% of outliers, you get a value that represents the pod's typical, steady-state load. It isn't skewed by brief, intense spikes or long periods of inactivity. Consider this the "comfort zone" for resource allocation. See CloudWatch statistics definitions for more information.
- Statistic:
For Ceilings (
limits): Use Maximum for memory and a high percentile for CPU (e.g.,p99).- Statistic:
Maximumfor Memory andp99orp95or another high percentile statistic for CPU. - Why: The penalty for exceeding a memory limit is an
OOMKill(pod crash); therefore, we must respect the absolute peak memory usage to ensure stability. The Maximum statistic gives you this worst-case number. Respect the peak.
- Statistic:
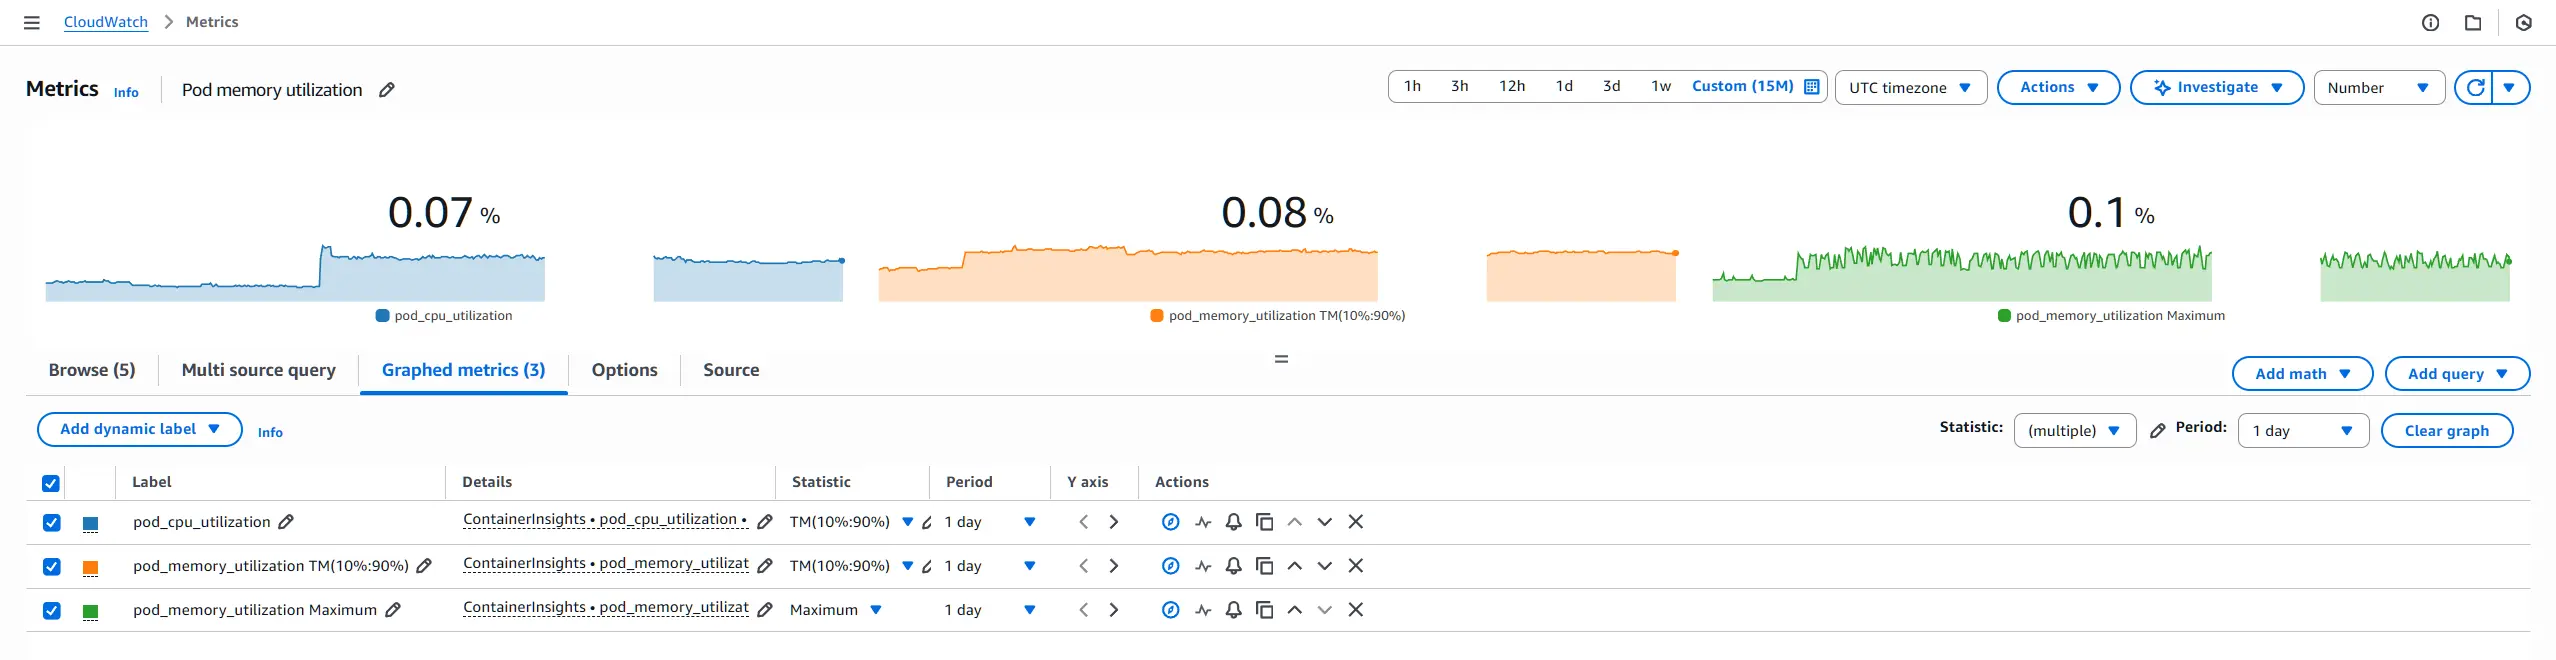
The CloudWatch graph may look similar to this:
For additional information, see the following:
- Amazon EKS and Kubernetes Container Insights metrics.
- Amazon CloudWatch Graphing a metric.
- Amazon CloudWatch statistics definitions.
Step 2: Calculate - The Formulas
Once you have your observed data, use the following formulas to convert the percentage-based utilization metrics from CloudWatch into the absolute values Kubernetes requires.
Prerequisites: You need to know the specifications of the EC2 instance type used for your Kubernetes worker nodes. Specifically, you need:
- Node
vCPUs: The number ofvCPUson the EC2 worker node instance (see EC2 instance types). - Node
Memory GiB: The amount of memory on the EC2 worker node instance in GiB (see EC2 instance types). - Buffer: Decide on a safety margin to handle unexpected load. A 15-25% buffer seems like a sensible default.
CPU
Requests
The following formula converts the trimmed mean CPU utilization percentage into millicores, which is the unit Kubernetes uses for CPU requests and limits:
CPU (millicores) = (Trimmed Mean CPU Utilization % / 100) * (Node vCPUs * 1000) * (1 + Buffer %)
NOTE
The following explains the components of the formula:
Trimmed Mean CPU Utilization %: The trimmed mean value you obtained from CloudWatch./ 100converts the percentage to a decimal.Node vCPUs * 1000: Converts the number of vCPUs to millicores (1 vCPU = 1000 millicores).Buffer %: A percentage (e.g., 0.25 for 25%) added to the request to provide a safety margin.
Limits
I recommend not setting CPU limits unless really necessary, as I find it can lead to unnecessary throttling when resources may be available on the node. However, if you must set a limit, use p99, p95 or other high-percentile metrics data to guide you. For example, the 99th percentile of CPU usage, which captures most spikes while ignoring extreme outliers:
CPU (millicores) = (p99 CPU Utilization % / 100) * (Node vCPUs * 1000) * (1 + Buffer %)
Memory
Requests
Memory (MiB) = (Trimmed Mean Trimmed Mean CPU Utilization % / 100) * (Node Memory GiB * 1024) * (1 + Buffer %)
NOTE
The following explains the components of the formula:
Trimmed Mean Memory Utilization %: The trimmed mean value you obtained from CloudWatch./ 100converts the percentage to a decimal.Node Memory GiB * 1024: Converts the node memory from GiB to MiB (1 GiB = 1024 MiB).Buffer %: A percentage (e.g., 0.25 for 25%) added to the request to provide a safety margin.
Limits
Memory (MiB) = (Maximum Memory Utilization % / 100) * (Node Memory GiB * 1024) * (1 + Buffer %)
NOTE
The following explains the components of the formula:
Maximum Memory Utilization %: The maximum value you obtained from CloudWatch./ 100converts the percentage to a decimal.Node Memory GiB * 1024: Converts the node memory from GiB to MiB (1 GiB = 1024 MiB).Buffer %: A percentage (e.g., 0.25 for 25%) added to the limit to provide a safety margin.
Step 3: Tune - Apply and Monitor
Once you've calculated the requests and limits, it's time to apply them to your pod specifications. For an example of how to set these values in Kubernetes, see the Kubernetes Container resources example.
After deploying the updated pod configuration, continue to monitor the pod's performance using CloudWatch and Kubernetes metrics. Look for signs of resource contention, such as CPU throttling or OOMKills, and adjust the requests and limits as necessary.

Advanced Considerations
These guidelines provide a solid foundation, but every application is unique. For example, the 25% buffer and TM(10%:90%) statistic are excellent starting points, but you can refine them.
Adjusting the Buffer: For critical production applications, you might increase the buffer to 30% or more. For less critical dev/test environments, you might reduce it to 15% or even lower.
When to use
TM(10%:95%)? Consider using aTM(10%:95%)for your requests. This trims the inactive bottom 10% but keeps more of the legitimate high-usage data. This is ideal for applications that have a low idle state but a frequent and predictable "busy" state. It will result in a higher, more generous request that can better accommodate regular bursts without relying on bursting above the request.Consider other statistics: Depending on your application's behavior, you might find that other statistics (like maximum, percentile or interquartile mean) provide better insights into typical usage patterns. See CloudWatch statistics definitions for more options. Experiment and see what works best for your workloads.
Conclusion
Setting the right CPU and memory requests and limits for your Kubernetes pods doesn't have to be a guessing game. By leveraging AWS CloudWatch to gather real-world usage data, you can make informed decisions that balance performance and cost.